General
Could Suction Wings Dominate the Retrofit Market?
Anders Vartdal, Senior Investment Associate at Motion Ventures

The Question Everyone's Asking: How do shipowners cut emissions fast… before alternative fuels arrive?
That's what's driving every decision in maritime right now. Regulations are live. Carbon has a price. Owners can't wait five years for ammonia or hydrogen to scale.
They need solutions now. Solutions that work on existing fleets. Solutions that pay back before the next regulatory ratchet.
Wind-assisted propulsion systems (WAPS) are emerging as a solution and within WAPS, one technology is pulling ahead: suction wings.
1. The Margin Squeeze: Carbon Is Now a Line Item
Shipowners face a twin pressure system that's reshaping maritime economics.
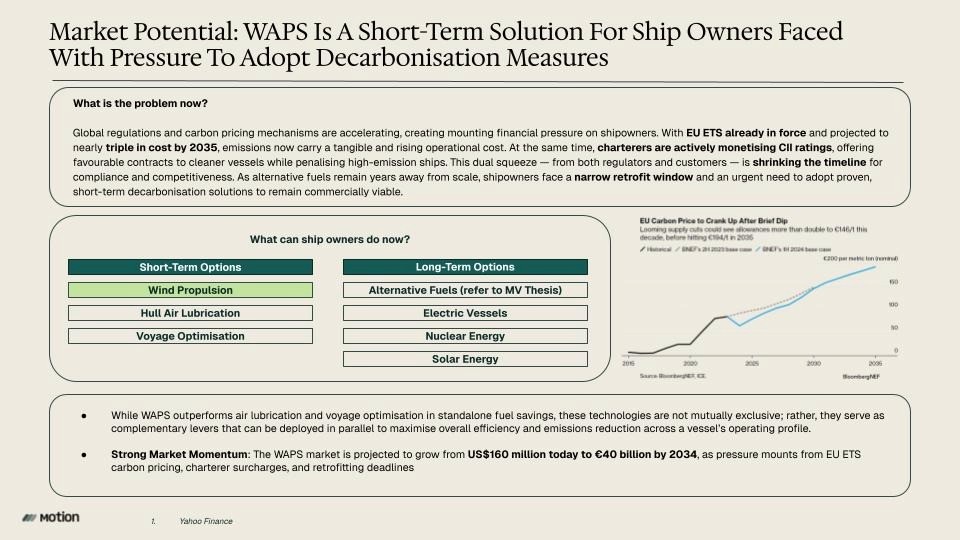
First, regulators are pricing carbon into every voyage. The EU Emissions Trading System hit shipping in 2024. Today's carbon price sits at US$ 84 per tonne of CO₂. In September 2025, Bloomberg projects US$ 137 by 2030 To illustrate, consider a mid-sized bulk carrier burning 20 tonnes of fuel per day, sailing 200 days a year predominantly trading in Europe, and using the standard marine emission factor of 3.114 tCO₂ per tonne of fuel, that's an extra US$ 1.05m in annual carbon costs at current rates—rising to US$ 1.71m by 2030.
Second, charterers are monetising efficiency. The Carbon Intensity Indicator (CII) rating system creates direct commercial consequences. High-performing ships command premiums. This isn't a future risk but happening in contracts signed today.
The math is brutal. An inefficient vessel might burn 10% more fuel than a comparable ship carries both higher fuel costs and a charter penalty.
What this means: Carbon isn't an externality anymore. It's an operational cost that compounds annually. Owners who don't address it lose competitiveness, access to capital, and their vessels' commercial viability.
2. The Timing Gap: Fuels May Not Scale for a Decade
The goal has always been to power zero-emission vessels but the long-term answer isn’t yet clear. Alternative fuels (ammonia, methanol, hydrogen) are all horses still in the race but without the finish line in sight.
But the timing of this transition is the problem.
Alternative fuels face a cascade of bottlenecks:
Infrastructure doesn't exist. Bunkering networks for green methanol or ammonia are nascent at best. Building them out requires coordinated investment across ports, fuel suppliers, and shipowners. There’s around a 10-15 year timeline.
Engines aren't ready. Dual-fuel engines for ammonia are still in demo phases. Hydrogen fuel cells face energy density challenges. Methanol works but requires significant engine modifications.
Supply is limited. Even where fuels are available, volumes are insufficient. Just to fuel Maersk's 19 methanol vessels, green methanol production needs to scale by 50x. Green ammonia doesn't exist at commercial scale yet.
New builds take time. If you order a new vessel today, you only get delivery in 2027-2028 at earliest - and owners won’t replace their entire fleet.
This creates a strategic gap: Owners must comply with regulations and stay competitive in the 2025-2035 window, but the technologies they're banking on for 2040+ won't help them in the interim.
3. The Retrofit Window: What Works Right Now
Owners are hunting for retrofit solutions that deliver immediate, measurable fuel savings without requiring new ships or new fuels.
The options break into three categories:
Operational optimisation (voyage routing, weather routing, slow steaming)
Gains: 3-8% fuel savings
Limitation: Most owners already did this. Marginal gains remain, but the easy wins are captured.
Hull and propulsion improvements (air lubrication, hull coatings, propeller upgrades)
Gains: 5-12% fuel savings
Limitation: Hull coatings degrade. Air lubrication most often require continuous power input. Neither generates thrust, they reduce drag.
Wind propulsion systems (WAPS)
Gains: 5-30% fuel savings
Advantage: The only retrofit technology that actively generates thrust using free energy. WAPS reduces fuel burn not by cutting losses, but by generating lift that moves the ship forward.
Wind propulsion stands apart. It's the only retrofit that directly offsets fuel consumption through renewable energy input. It's also the only option that becomes more valuable as carbon prices rise because it eliminates emissions rather than just reducing friction.
This is why the WAPS market is projected to grow from US$ 164m in 2024 to US$ 40b by 2034.
4. The Technology Landscape: Four Systems, One Emerging Leader
Four wind propulsion technologies compete today. They differ sharply in performance, integration complexity, and how fast they can scale.
Parafoil Kites: Easy Install, Unreliable Performance
Kites deploy from the bow and fly at altitude, generating pull. Lightweight, minimal deck space, fast installation.
The problem: They only work in favorable wind conditions. In headwinds or light winds, they contribute nothing. Their operational window is narrow, roughly 70-140° relative to the apparent wind. They sit idle for large portions of most voyage profiles.
Capital costs are high relative to inconsistent output. Payback periods stretch past 8 years. Adoption has stalled. They won't scale.
Flettner Rotors: The Established Baseline
Flettner rotors are vertical cylinders that spin to generate lift via the Magnus effect. They've been in commercial use since 2010 and have a proven track record.
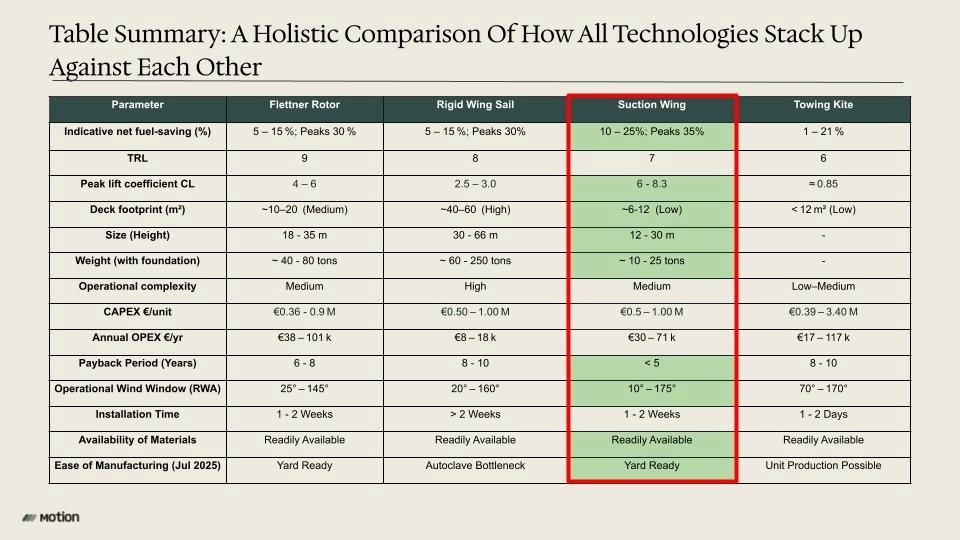
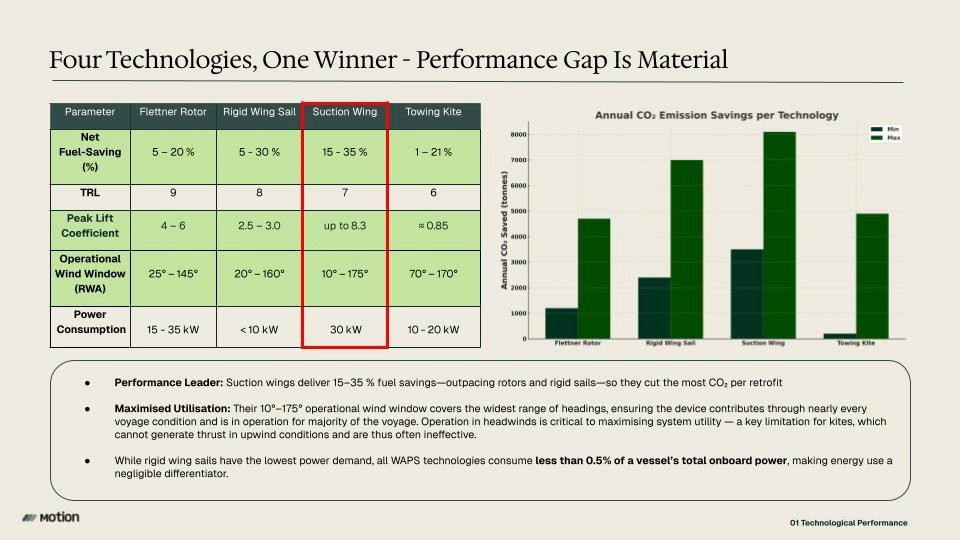
Performance: typically 3-15% fuel savings - up to 20% in favourable conditions, depending on route and wind conditions. Lift coefficient around 6. Operational wind window roughly 30-150°.
Integration: Simple. Steel construction. Minimal deck footprint. Installation takes 1-2 weeks during a dry-dock. Heights around 30 meters keep them within most port clearance limits.
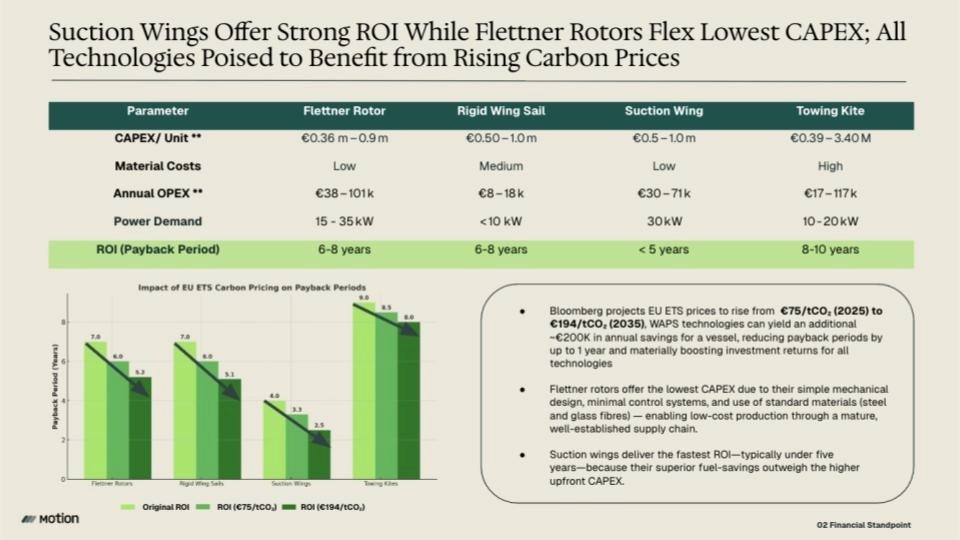
Economics: CAPEX ranges from US$ 450k - US$ 675k per unit. Payback periods of 6-8 years. With rising carbon prices, this shortens to 5-7 years.
Supply chain: Mature. Steel fabrication is well-understood. Multiple OEMs can produce rotors in parallel across global shipyards.
Limitation: Aerodynamic efficiency caps their upside. Lower lift coefficients mean less thrust per unit. They contribute for fewer hours of a voyage compared to more efficient systems.
Verdict: Flettner rotors are reliable and cost-effective. They'll continue to serve budget-conscious retrofits. But they're not the performance leader.
Rigid Wing Sails: High Performance, High Complexity
Rigid wing sails are tall, fixed aerofoils: airplane wings mounted vertically. They generate lift through classical aerodynamics.
Performance: 5-30% fuel savings in ideal conditions. Lift coefficient around 2.5-3.0. Operational wind window roughly 20-160°.
The problem is integration.
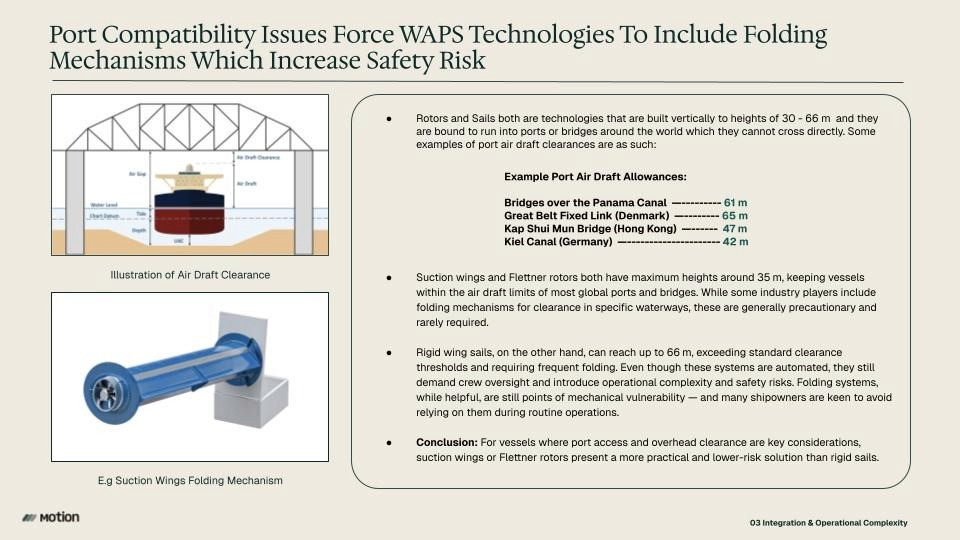
Size: Heights reach 40 meters. This exceeds clearance limits for many ports and ridges. Operators must install folding mechanisms to pass under obstacles like the Kiel Canal (ca. 40m clearance) or Welland Canal (35.5 m above waterline)
Weight: Rigid sails weigh 150-250 tonnes including foundation. This requires significant structural reinforcement and affects vessel stability. Ballast adjustments are often necessary.
Deck footprint: 40-60 m² per sail. This obstructs cargo operations, especially on smaller vessels.
Folding mechanisms add risk. Even when automated, they require crew oversight and introduce mechanical failure points. Many owners are reluctant to depend on moving parts in safety-critical systems.
Manufacturing bottlenecks:
Rigid sails rely on aluminum frames and glass-fiber composite shells. Achieving the required strength-to-weight ratio demands autoclave curing: high-pressure, high-temperature ovens that consolidate the composite layers and minimise voids.
Autoclaves are scarce in shipbuilding hubs. Significant capex required. Operating one requires specialised labor. Most yards don't have them. This creates a production bottleneck that limits how fast rigid sails can scale.
Out-of-autoclave (OOA) processes exist, but they introduce quality variance. Void content is harder to control. Mechanical properties are less predictable across different manufacturing sites.
Economics: CAPEX of US$ 900k to US$ 1.35m per sail. Payback periods of 7-10 years.
Orderbook: Only 31 contracted units as of Q2 2025.
Verdict: Rigid sails deliver strong performance under ideal conditions. But their size, weight, and manufacturing complexity make them hard to scale. They'll remain a niche solution for specific routes and vessel types.
Suction Wings: The Performance + Scalability Leader
Suction wings take the rigid sail concept and upgrade it with boundary-layer suction. This is the key innovation separating them from passive sails.
How it works:
Small perforations cover the wing surface. Internal fans pull air through these holes, removing the boundary layer that would otherwise cause flow separation. This keeps airflow attached across the entire wing surface, even at high angles of attack.
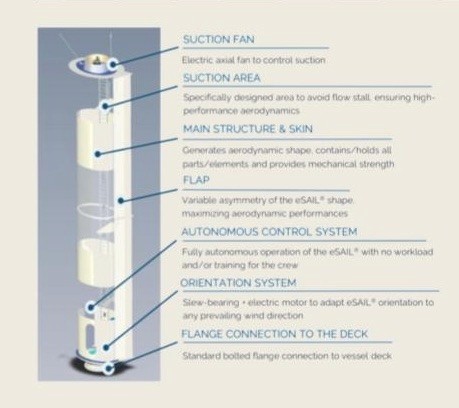
The result: lift coefficients of up to 8.3. This is more than double Flettner rotors (6.0) and nearly triple passive rigid sails (3.0).
Performance: 15-20% fuel savings and up to 30% in favourable conditions. Highest range of any WAPS technology. The wide operational wind window (10° to 175°) means suction wings contribute thrust across nearly every heading except directly downwind.
Key advantage: Suction wings work in headwinds. Most WAPS technologies lose effectiveness in upwind conditions. Suction wings generate thrust even when sailing into the wind: maximising utilisation across the voyage profile.
Integration:
Size: Heights of 10-36 meters. Keeps them within standard port clearance limits. Folding mechanisms are optional, not required.
Weight: 10-25 tonnes including foundation. Significantly lighter than rigid sails. Less structural impact on vessel stability.
Deck footprint: 6-12 m² per wing. Minimal disruption to cargo operations.
Installation: 1-2 weeks during a scheduled dry-dock. Same timeline as Flettner rotors.
Manufacturing:
Suction wings use steel construction. This matters for scalability.
Steel is abundant. Every shipyard knows how to work with it. Quality control is straightforward. Parallel production across multiple yards is feasible today.
No autoclaves required. This removes the manufacturing bottleneck that constrains rigid sails.
End-of-life is simple. Steel is 100% recyclable. No composite disposal challenges.
Economics:
CAPEX: US$ 750k – US$ 1.25m per wing: comparable to rotors and lower than rigid sails.
Payback period: Under 5 years at current carbon prices. With estimated EU ETS rising to US$ 219/tCO₂ in 2035, payback shortens to under 4 years.
Orderbook momentum:
120 contracted units as of Q2 2025—double the Flettner rotor orderbook (60 units) and 4x rigid sails (31 units).
Suction wings have matched rotors in live deployments despite entering the market later.
The data shows where operators see the balance: superior performance, practical integration, and scalable manufacturing.
5. The Carbon Multiplier: Economics Under Rising ETS Prices
Capital costs across WAPS technologies are broadly similar: US$ 450k to US$ 1.3m per unit depending on size and complexity.
The decisive factor is fuel savings multiplied by carbon price escalation.
Suction wings' wider wind window and higher lift coefficients mean they generate thrust for more hours per voyage. This translates to consistently higher fuel savings and higher carbon savings.
At today's EU ETS price of US$ 84/tCO₂, using the same mid-sized bulk carrier example and the 10% CO₂-reduction assumption, a typical installation saves an owner US$ 105k annually in avoided carbon costs alone. That's on top of fuel savings.
When ETS prices hit US$ 219/tCO₂ by 2035, using the same assumptions, annual carbon savings will climb to US$ 273k. This single variable can cut a full year from the payback period.
The gap widens as carbon prices rise. Higher fuel savings compound faster. The systems with the best aerodynamics capture disproportionate value.
6. Why Suction Wings Could Dominate
The WAPS market is projected to grow to US$ 40b by 2034. Within that market, suction wings seem positioned to be the structural winner.
They combine four advantages:
Superior aerodynamic performance → highest fuel savings, widest operational window, greatest carbon reduction
Practical integration → smaller, lighter, easier to retrofit than rigid sails; no folding mechanisms required
Scalable manufacturing → steel construction removes production bottlenecks; parallel fabrication across global yards
Fastest ROI → payback under 5 years today, shortening to under 4 years as carbon prices rise
Market signals support this view:
Orderbook growth is steepest for suction wings (120 units vs. 60 for rotors, 31 for rigid sails)
Live deployments are accelerating despite suction wings' later market entry
Charterers are beginning to specify WAPS in new contracts and they're prioritising the systems with the highest fuel savings
Flettner rotors will maintain share in cost-sensitive retrofits. They're reliable, proven, and cheap. But they're not the performance leader.
Rigid sails will remain niche due to manufacturing bottlenecks, integration complexity, and operational risk from folding mechanisms.
Kites won't scale due to inconsistent performance and narrow operational windows.
7. Where to Deploy Capital
The investment window is open now before the market consolidates and before incumbents catch up.
Why now:
Market is pre-consolidation. Multiple OEMs are demonstrating performance and building orderbooks. Valuations haven't priced in full market potential yet.
Manufacturing scale-up is happening. OEMs are signing partnerships with yards, building production capacity, and proving repeatable quality.
Regulatory tailwinds are accelerating. EU ETS expansion, CII tightening, and green finance incentives are all pushing owners toward the highest-performance solutions.
Risk mitigation:
Performance-linked contracts: Tie payment milestones to verified fuel savings. This aligns OEM incentives with owner outcomes.
Shipyard partnerships: OEMs with strong yard relationships can deliver on-time installations and tap into existing maintenance networks.
Supply chain diversification: Ensure access to steel fabrication across multiple geographies to avoid bottlenecks.
The window may close if:
Flettner rotor manufacturers upgrade their designs (raising their lift coefficients) or rigid sail manufacturers solve their production bottlenecks (enabling faster scale)
Large maritime incumbents (engine makers, propeller manufacturers) enter the space through M&A or internal development
Market consolidation pushes valuations higher as the category proves itself
The Bottom Line
Shipowners face an immediate problem: cut emissions now or lose competitiveness. Alternative fuels likely won't scale for a decade. WAPS appears to be the only retrofit solution that directly generates thrust from renewable energy.
Within WAPS, suction wings seem to deliver the highest performance, fastest ROI, and most scalable manufacturing. The orderbook suggests strong market momentum. Carbon pricing amplifies the economic advantage. The technology is proven.
We think now is the time to back the leading suction-wing OEMs, while the market is still pricing them as emerging players rather than category leaders.
Appendix: Research Referenced
Lloyd’s Register & UMAS – “Zero-Emission Vessels: Transition Pathways 2023”
Maersk, 2023 Green Methanol Market Assessment
DNV Maritime Forecast to 2050 (2023)
Clarksons Research (World Fleet Monitor, 2023–2024)
Drewry Shipping Insight, 2023
DNV – “Wind-Assisted Propulsion: Technology Overview” (2020)
Fraunhofer Institute – E-Ship 1 Case Study (2010)
IMO/GreenVoyage2050 & related portals
DNV whitepaper: Wind-Assisted Propulsion Systems (WAPS) - How WAPS can help to comply with GHG regulations; Čalić, A., Jurić, Z., & Katalinić, M. (2024).
Impact of Wind-Assisted Propulsion on Fuel Savings and Propeller Efficiency: A Case Study. Journal of Marine Science and Engineering, 12(11), 2100.
All other figures referenced come from Motion Ventures' Industry Research
Appendix: Comparative Data
Performance Comparison
Technology | Fuel Savings | Lift Coefficient | Wind Window | Payback Period |
Parafoil Kites | 5-15% | N/A | 70-140° | 8-10 years |
Flettner Rotors | 3-20% | ~6 | 30-150° | 6-8 years |
Rigid Wing Sails | 5-30% | 2.5-3.0 | 20-160° | 7-10 years |
Suction Wings | 15-30% | 8.3 | 10-175° | <5 years |
Integration Comparison
Technology | Height | Weight | Deck Footprint | Installation Time |
Parafoil Kites | N/A | <1 tonne | ~5 m² | 3-5 days |
Flettner Rotors | 18-35m | 15-30 tonnes | 10-20 m² | 1-2 weeks |
Rigid Wing Sails | 40m | 150-250 tonnes | 40-60 m² | 2-3 weeks |
Suction Wings | 10-36m | 10-25 tonnes | 6-12 m² | 1-2 weeks |
Orderbook Status (Q2 2025)
Suction Wings: 120 contracted units
Flettner Rotors: 60 contracted units
Rigid Wing Sails: 31 contracted units
Parafoil Kites: Minimal uptake; limited orders
Port Clearance Constraints
Location | Air Draft Limit | Notes |
Panama Canal bridges | 61m | Rigid sails require folding |
Kiel Canal (Germany) | 40m | Most WAPS fit; rigid sails borderline |
Great Belt (Denmark) | 65m | Rigid sails can exceed without folding |
Kap Shui Mun Bridge (Hong Kong) | 47m | Rotors/suction wings clear; rigid sails must fold |
Suction wings and Flettner rotors stay within standard clearances. Rigid sails frequently require folding mechanisms, adding operational complexity and safety risk.


